The commoditization (and devaluing) of trade data and trade data based products is accelerating, perhaps inversely proportional to the quality and number of suppliers and products in the marketplace.

Field of Wheat
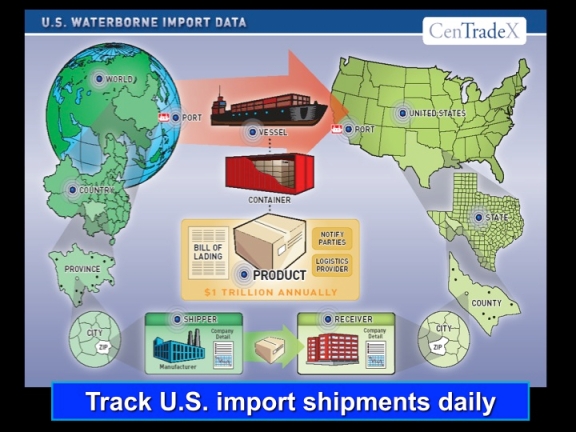
Let’s look at one of the most treasured (and perhaps useful) types of trade information – U.S. Customs Waterborne Import Manifest Data. Automated Manifest System data, sometimes called “AMS”, is information collected daily by DHS (Department of Homeland Security) U.S. Customs for and about each and every ship and shipment bound for the U.S.. Thousands of imported shipments are logged everyday. Each manifest contains information about the foreign shipper (exporter), the receiver (importer), details on the product shipped and various logistical specifics on routing.

Harvested Grain
“Back in the Day” when I founded CenTradeX in the summer of 2000, only PIERS offered such information. Primarily, it was distributed to customers via a stack of CDs each and every month. The user hunted through an Excel type interface for specifics on a particular product, shipper or importer. For elite customers, PIERS offered a plethora of prepared reports. (One of their customers once showed me a CD containing over 57,000 such reports). Slowly, PIERS converted such customers to an on-line system which also served to reduce rampant piracy.

Refined Flour
In the last 5 years, available technological resources have grown exponentially. Correspondingly, vendors offering access to and products based upon the U.S. Customs Waterborne Manifest Data have proliferated like bunnies. On the one hand, this has led to increased competitive pressures which have driven innovation forward, quality upward and prices downward. On the other hand, there is a widening gap between data and intelligence.
I stayed awake until 2:00 a.m. one evening recently, trying to catch up on all (that I could find) of the NEW vendors offering AMS data… WHEW! The data has gotten incredibly cheap. The quality of companies /products are mixed. Some look like they are solo operations run out of someone’s garage. Others are incredibly slick.

Loaf of Bread
The first competitor (not including my company CenTradeX) on the scene was Zepol. Started by two young fellows out of Minnesota – they had a simple business plan – improve on PIERS’ search utility and undercut PIERS’ price by 20%. Slowly they made headway. They were followed by Datamyne, Import Genius and Panjiva, which appeared in the last several years. Now, add to the list Manifest Journals, Cybex, Info Drive India, IE Intelligence, Trade Intelligency, Data Trade, Trade Mining, Import Intel, TradeKey, Vanguard…

Sometimes quality doesn’t have a price tag.
At the peak of the pyramid in price and quality /value is PIERS (of course) – a handful of “G Notes” will buy you the best. Second tier providers include Datamyne, Zepol, Import Genius and Panjiva whose prices range from a few Benjamins to a couple of Clevelands (the President on the now defunct $1,000 bill). Cascading down the food chain are the bottom feeders, like Manifest Journals, Cybex, Info Drive India and the others, which offer access to AMS data for as low as $30.10 a month.
The current or prospective user of “trade intelligence” products and resources must decide upon which “values” he values most. It’s cheaper to harvest the wheat yourself… you can purchase the raw AMS data directly from U.S Customs for $100 per day. Maybe even start your own company. Heck, the last three CEOs of PIERS did just that. They either run or have founded companies in the list above.
*This post was originally published during the first week of May, 2011.


 31/07/2013
 0 Comments


 The location – company match utility also can be used to link unlinked branch locations to their respective parent company or regional/ divisional headquarters. Furthermore, it can process and link a proprietary client’s database of customers as well. In this fashion, one can monitor customer’s trading activity and supply chain operations on a daily basis! This information can be incorporated into a web application which is distributed within the secure company intranet or protected proprietary web site. An example is Panalpina, one of our previous (CenTradeX) clients wherein we integrated their proprietary information into a customized web application for distribution to their regional sales offices.


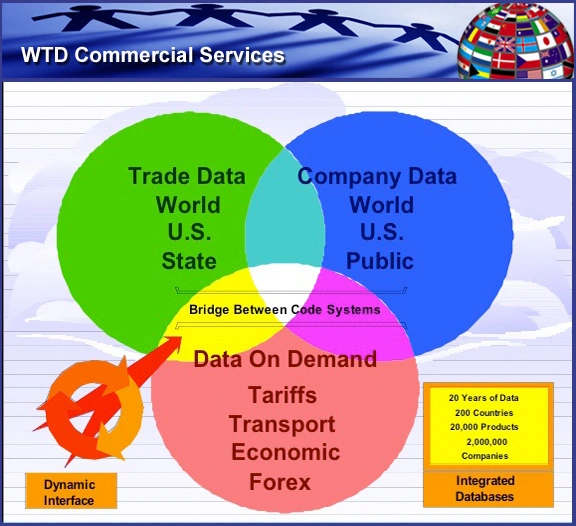
 I refer to U.S. Customs waterborne import manifest data as the “base” data because it is considered (by myself and many others) the most intrinsically valuable, if challenging, international trade data set available. It’s daily. It’s transactional. The U.S. is considered the easiest market to access. It contains a wealth of detailed information about the global supply chain. It represents $1 trillion dollars of trade a year.

 There are a number of previous articles wherein I have referred to other shortcomings and challenges inherent with the understanding and applying U.S. Customs data. Please note the following:
 We also published several dozen articles focusing on the current Trade Intelligence purveyors of Customs data. The links provided below will pull up a handful of articles each – for a particular company, group of companies (in cases where they are “minor, second tier” providers) and summary evaluations. You can also find these articles, and others grouped by various categories, on the top navigation menu of this site.


 If not accounted for, you have multiple (and inaccurate) shipments counts. The difficulty is that the only way to adequately correct the problem is to go back into already processed and published data to completely erase and replace the previous record or retain the inaccuracy.
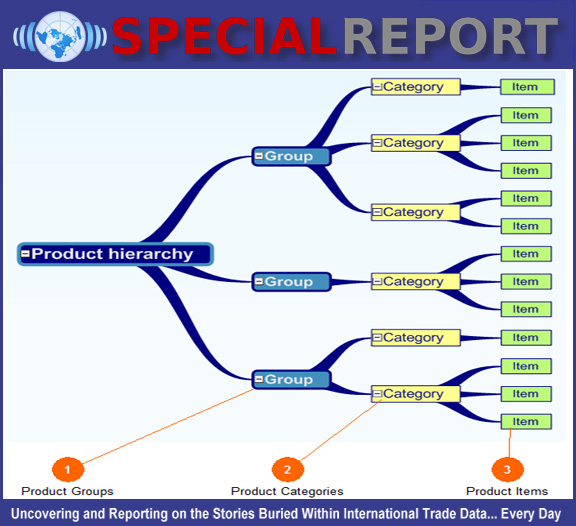
 Unfortunately, U.S. Customs data and U.S. Census data are asynchronous in many important ways. For reasons beyond the scope of this article, it is impossible to take a record of all waterborne shipments for the month of January from U.S. Customs and seamlessly overlay it with the aggregate statistical record of imports provided by U.S. Census. Further, the HS product categorization system is many times either too specific or too broad to apply.
 How? Several methods. Although presumably “suppressed”, tens of thousands of transactions slip through the filtering methods applied by U.S. Customs technologies. Port pairs (matching foreign port with U.S. port) for a particular product also yield significant dividends. The “product description” and “marks and numbers” fields contained on the shipping manifest sometimes contain references to either Wal-Mart or one of its known suppliers. Product identification information – SKUs, trademarks, etc.- are also sometimes found.
 To understand what you can and can’t get from U.S. Customs data… we need to dig into what it is and why it is… what it has and what it doesn’t have… what current T.I. providers are doing to enhance the base data… where the holes are and how best to fill them.


 Beyond the resources referenced above, which are mostly places to get hard facts, data and charts, it still remains a matter of interpreting the data, making sense of it, seeing patterns, making observations, and “spicing” /dressing it up a bit with some Google research as well as your own intuition (based upon intelligence, knowledge and experience).